I was lucky enough to get my hands on the Method-R Profiler and had a test drive with it. So first of all what is it? As you might expect a profiler, a profiler for Oracle performance problems. The tool makes use of Oracle’s trace facilities. If you have a performance problem with the database or a specific issue in you code, you are able to set a specific part of your code, or if must be, the whole database in trace mode. The database will write the output of your trace to the UDUMP, user dump, destination or in the trace directory of your database diagnostic section on the database server, depending on your database version.
Consistent Analysis
Pete Finnigan has a nice post about how you can achieve this called “How to set trace for others sessions, for your own session and at instance level“. As also is mentioned in this post, the Oracle TKPROF tool can be used to analyze the generated trace files. One of the disadvantages, IMHO, is that if you give such a TKPROF generated report to, lets say 10 Oracle (DBA) performance interested people, you will get afterwards 10 different analyses regarding what is reported in those reports. This is, among others, also caused by the fact that people most of the time sort the report in different ways. If you are not sure what the cause is for your problem, can’t determine it within context, this might even obfuscate the issue even more.
TKPROF is one of the most known tools used for this task. Of course their are also others like the Oracle Trace Analyzer that might do a better job in your case. As in all cases, while using tooling, use the one who suits you best for the task, but then again, you might not want 10 different opinions about “What’s wrong” or “Might be wrong…?”.
This is where the Method-R Profiler might be of use for you. As the naming references, the profiler is based on the Method-R performance analyzing method. As mentioned on the site of the Method-R main site: “Method R is a fast, effective, commonsense approach to optimizing a system. It was first documented in the book Optimizing Oracle Performance by Method-R founding members Cary Millsap and Jeff Holt.” This book has been, is still, one of the landmarks on the subjects of Oracle performance analysis, and a consistent way, based on response time statistics, to get an answer where your time went or, in case of performance problems, where too much time went, where it shouldn’t…
In my opinion, when dealing with performance problems, you always should have a broad look at what is at hand, keep the context in scope. So I like to use more tools and methods while looking at a problem, if not only, looking outside the “database realm”. Sometimes you find “funny” solutions, causing the problem, that might not even be database related as, for example, a misconfiguration in your network resolving configuration files/settings. It will take you ages to figure those out if you pinpoint only on the database side. As I sometimes explain it to colleagues or others, if you see someone sweating very heavily, do you think if he has a fever, burning him up? It might be that the heavy sweating is only caused due to an intensive 10 mile run… So you need context, more info, but at least consistent data, not a single method that gives you 10 different opinions of 10 different people. And yes, there are more good methods out there like YAPP and Oracle’s DB Time Analysis, but as with all good tools, they have their pro’s and cons, if not only they are as good as the people using them.
The Method-R Profiler
Consistent is key here… Consistency based on a method that has proven his merits in the performance community, to get fast and accurate results. That is what the Method-R Profiler will provide you with, consistency, based on trace file input and a method that has proven very useful in performance analysis. Another advantage is that it the tool will profile all the trace file content given and puts it in context based on the Method-R methodology, that is performance result measurements in the context of response time analysis. One of the things I like is that it also takes into account where time was not spend, said differently, database things “doing nothing”. In the case of a network resolving issue, this could be one of the hints you might get from a Method-R profiling report signifying: “your problem is not in the database, but outside it, see the round trips/time spend…”. As said, I like context information and me being lazy, I don’t want to spend time database tuning when my customer, most of the time a user trying to do things in a web browser, is not interested in optimizing database processes that are 1% percent of his performance problems.
The Package
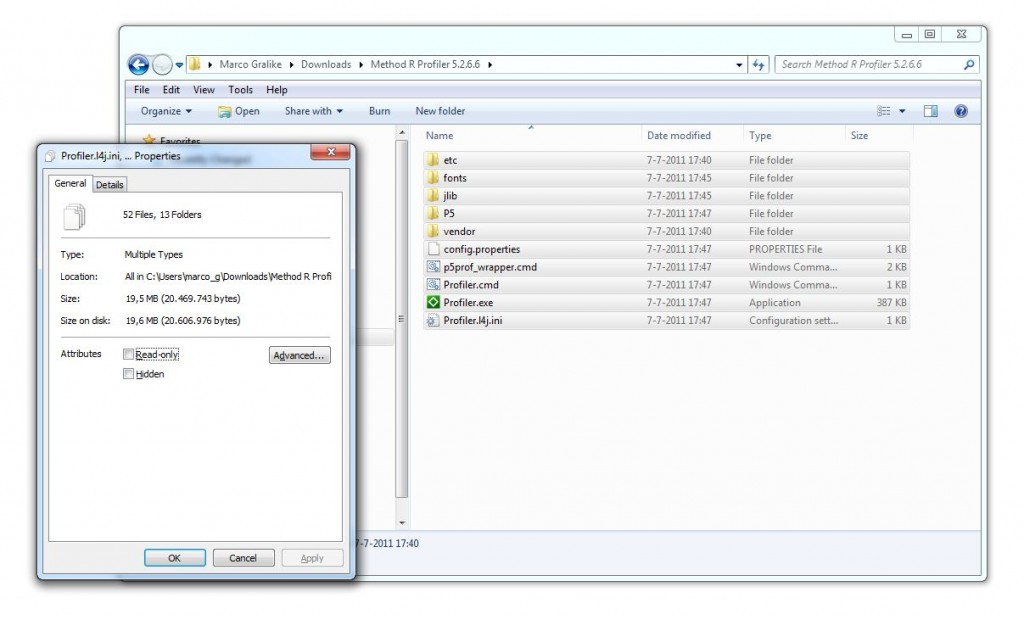
The Method-R Profiler is available for multiple platforms (Windows/MacOS/Linux), and after registration, can be downloaded for via the Method-R customer portal. Here you get access to among others, presentations, articles, papers, support links and the actual download area for your purchased product and services. In my case a download link for the Java based Method-R Profiler, The Method-R Tools toolset and the User Guides in pdf format. The Profiler is very small and nicely packaged in a zip file of 14 MB in size and when unzipped in a directory is still not more than 20 MB in total size (pdf, user manual included).
This is great to know, for example, if you want to put it on your USB emergency toolkit drive, especially if you know, that this is all that is needed for standalone usage. Another good thing to know about the Method-R profiler is that you can use it on the command line as well, so if needed, you can automate, for example on Linux via shell scripting, trace profiler tasks and mail its report every morning to a mail account.
Test Driving
When I started testing with the Method-R profiler (build 5.2.6.6) for Windows, I started realizing that it is also effective in that perspective. I don’t only get consistent profiled results, but also fast, really fast, provided of course, if you feed it the correct trace data. I started of testing by putting my database, for fun, in full trace mode, generating trace files for each and every process, action, done in the database. In my case, I used the Java GUI of the profiler and fed it with these 200+ trace files, generated after a day from my Oracle 11g XE database “doing nothing”. This is a nice exercise if you are conceptually interested in what the, most of them, database background processes are doing but, as I realized, not very useful in testing this tool. So I asked a colleague of mine to provide me with a real trace file of a performance problem he and others were currently looking into.
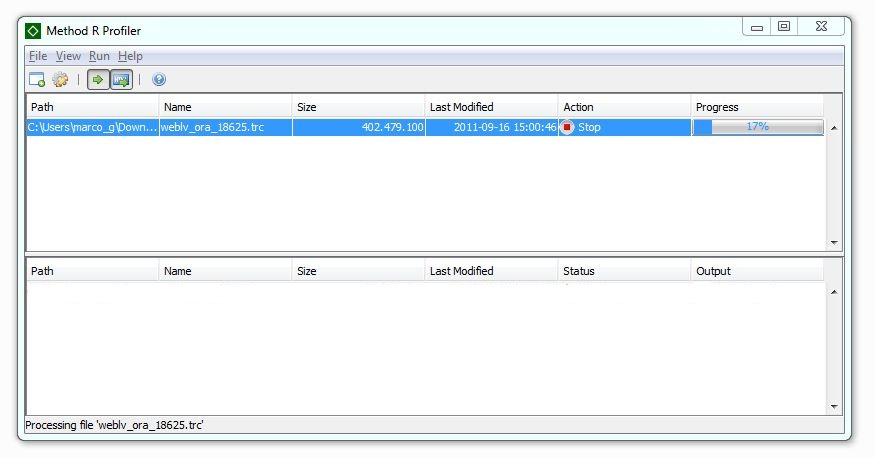
The Method-R Profiler busy building a profile report
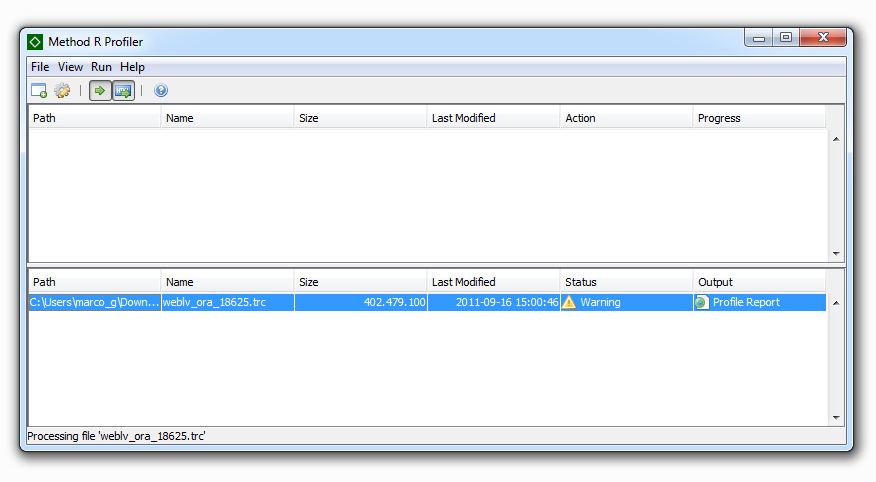
The Method-R Profiler after it had done this job
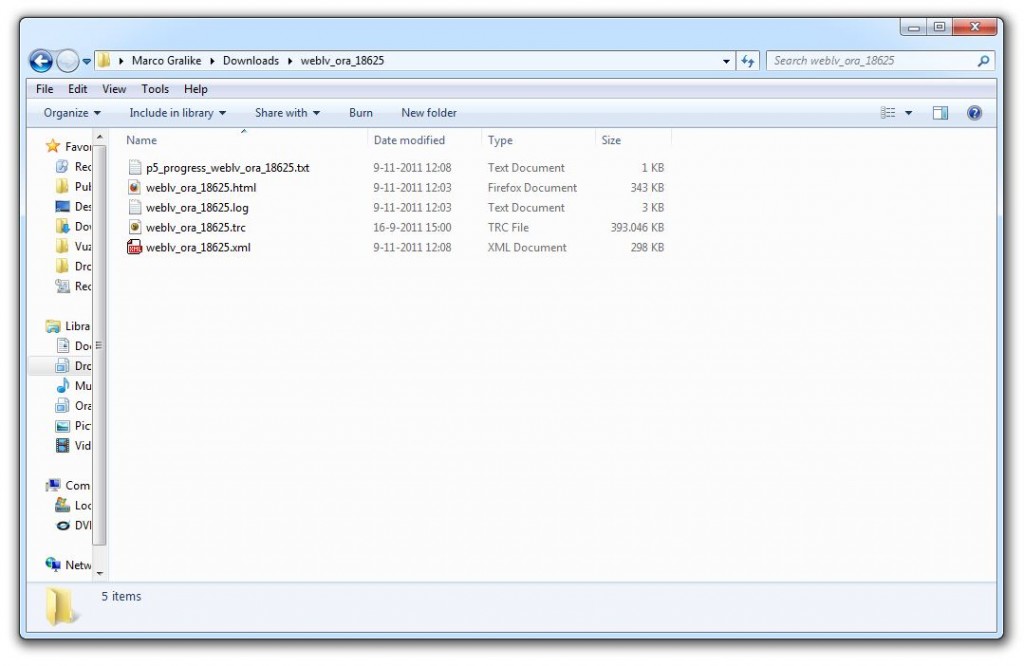
The directory in which I moved my to be analyzed trace file showed the following content afterwards
It contained a text file with the remark of “100%” analyzed, a log file that contained the way the profiler was used regarding, among others, processing parameters and versions used, a HTML file that contained the report details and a XML file that contains report metadata and data. Via the content of this XML file, if needed, you can rerun the profile analysis based on different profiler parameters, instead of profiling the original trace file(s) again. Also, of course, due to its format in XML, you can use this data for trending or in other tools. Via the GUI (via the menu or right click option while selecting a specific report) or command line, also a skew analysis can be made based on the now available data, if needed in HTML format.
The approximately 400MB single trace file, I got from my colleague, loaded in around 5 minutes, that is, was profiled / analyzed by the tool and immediately afterwards presenting a profiling report in XHTML format. This HTML file opens automatically in your default browser, if this option is not disabled in your Method-R Profiler menu. The html profiler report will show you the performance results, displayed in decreasing order of importance to the whole and will pinpoint you towards (in 3, 4 clicks as show below) the most awkward performance issue found in the trace data.
The Profile
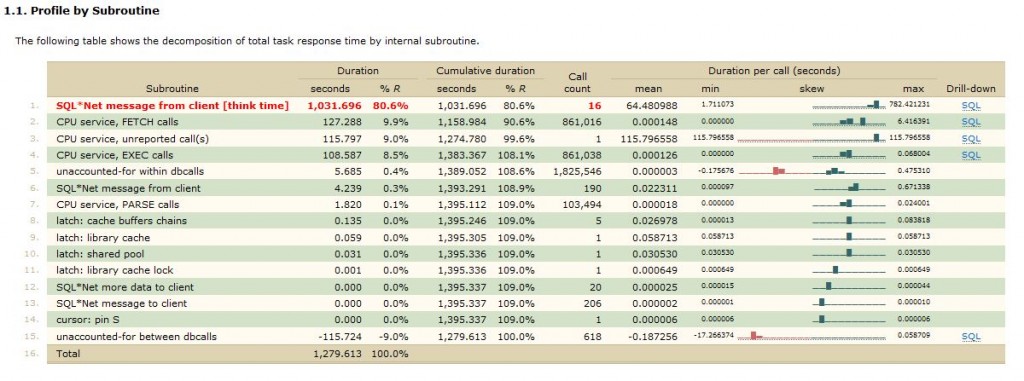
As explained detailed in the Method-R Profiler User Guide, besides in the header displaying a lot of info about the who/what/where of the analysis, the most interesting section starts immediately afterwards in the top level of this on XHTML based report.
This interesting section called the “Profile by Subroutine” points you were the time went of the content in your trace data.
Under the “Drill Down” section, you now can click the “SQL”-URL which leads you to “Statement Contributors” section of the offender(s).
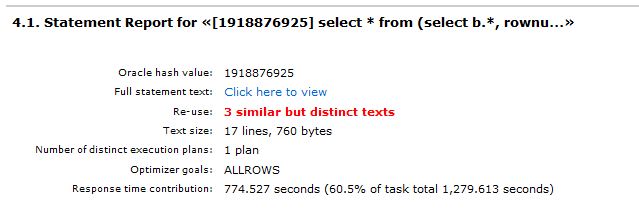
Zooming in further via the “stats”-URL in the Drill Down column brings you into the overview section for this statement/finding.
Clicking on the “Click here to view” URL of “Full statement text” part brings you in the report to the statement/finding that was reported above.
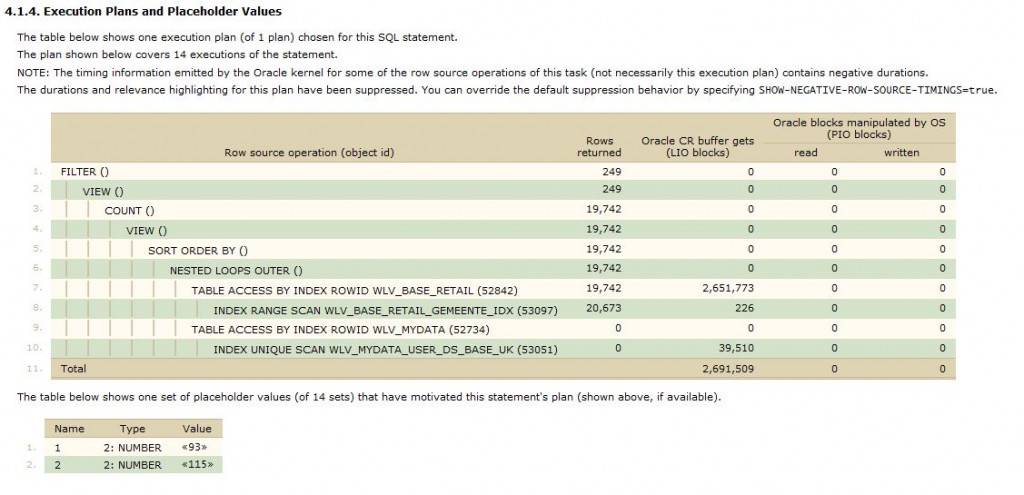
More detailed information can be found in this section about the statement reported like the explain plan output
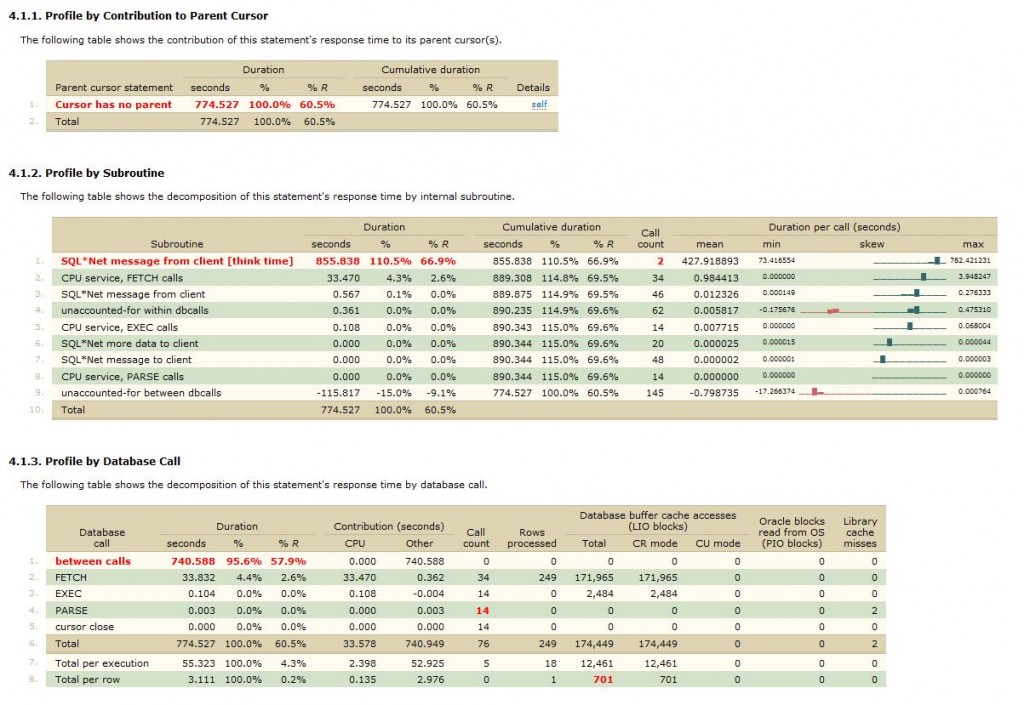
or more information like “Profile by Contribution to Parent Cursor”, “Profile by Subroutine”, “Profile by Database Call”, as shown below
Et Voila…! I got a starting point with detailed information, that I can use in my overall plan to solve the performance issues at hand. And as you might have guessed my 1031 seconds response time profile of this statement is a good point to start. Is there more info? Yeah, there is, but that would take to long to describe here (for now). But…it has also distribution overviews / “skew” graph’s that lets you see the impact of a detail compared to the whole, etc.
Others?
In the Profiler user guide, you will detailed information about installation and troubleshooting the installation, if needed, for the different OS flavors, a detail step by step Report walk-through, how the command line interface works and besides the basis for the Profiler, also how the Skew Analyzer and “Decompression Filter” (unzip explicit commands for .bz2, .zip, .gz, .lzf, .lzo files) can be used. Besides describing the patterns mentioned in the report, of which most of them should be familiar because the are Oracle’s of origin like for example “log file sync” and “SQL*Net message from client”, also options for report format and tolerances used are described. So in all there is a lot to tweak if you need more or less info or within different specs.
Verdict
Am I biased? Yes probably I am, because I have seen Cary Millsap present during conferences. 😉 .That said, I am also me and Dutch…so…
…initially I was a bit disappointed regarding the sparse interface of the GUI. In the end, the Method-R Profiler is not cheap and there aren’t that many buttons defined in the tool, but after thinking a lot about it, it (the KISS interface) became to grew on me. Especially after I read that you can extent the Oracle SQL*Developer tool with the Method-R MrTrace extension (that makes trace files accessible for you via SQL*Developer, among other things), which can call this Method-R Profiler. In that setting, using it in that combination, there are more then enough buttons, if you want to. This setup makes it very interesting for the experienced, “design for performance” aware, senior Oracle developer.
In the “as is” lightweight format, this is also a great tool for performance consultants or senior (and up of course) database administrators. It’s tweak-able, if you need it to be, it can be used in command line mode for automation and it has great value for money. Don’t forget my test-use-case… Within half an hour, I presented to my colleague, the offending SQL statement. He needed almost 2 days to figure out the same, after long discussions with other team members, fiddling with report options in tkprof and the trace analyzers and trying to see it all in context; regarding the info presented in his reports. The Method-R profiling method has its merits on that account that you can skip most of these pointers and pinpoints you towards the problem at hand, in context, via profiling. Less time spend is, also in this case, less money “wasted”. Be aware though, as mentioned by me earlier, that every tool is only as good as the person that uses it. It will not help you with understanding the theory/basics at hand. Next step for me, in this case, was a deep dive into Oracle Spatial performance optimization…
Enhancement requests for the Method-R development team regarding this product? Please put in a “Marco, are you serious regarding opening 200+ HTML profiler reports” – alert box with a “Yes/No” buttons, although I discovered that you can disable the automatic open in HTML internet browser Window. This phenomenon is also known as: “Complaining about to few menu options, but don’t read/check the options that actually are available in the first case, Stupid!”-mistake. 🙂 . An other one would be to create a menu option or page which enables you to mark check boxes for the specific tweak options of the profiler, instead of a text box that you can use to enter the full option parameter string. After having spend to much time in my life trying to figure out where the syntax error is on a java application parameter command line, this probably would harden the GUI and avoiding mistakes, for example, referencing parameters in the wrong way or format.
In all. I like it very much. Its lean, its mean, it profiles and it’s consistent, so in my mind, a great asset or replacement for other tooling. It’s also relatively cheap if you use it in the right work/consultancy context. I believe the term here is “great value for money”, if not only that performance problems in general can drag along for a long time, costing the customer or project more than it should. Bringing down that time spend, is already a great asset.
M.


Have You tried
SQLT (SQLTXPLAIN) – Tool That Helps To Diagnose SQL Statements Performing Poorly [ID 215187.1]
I’ve found it pretty useful.
Regards
GregG
No I haven’t yet, thanks for the suggestion. I will look into it.
…then again I am not looking for a tkprof report alternative for Oracle trace files but am more interested in a trace profiler, that is, based on a tuning method. One that picks out the worse statement(s), based on that method, shows them in order and put it into context like DBTime alternatives in OEM (via using the Oracle tuning, diagnostics pack).
This review is about the Method-R profiler, not a comparison of profilers.
In the end you will have to pick what works for you.
What I have read on the internet, SQLTXPLAIN is a tkprof alternative and not a profiling tool.
SQLTXPLAIN doesn’t strike me as a tkprof alternative as it has little to do with the Oracle Wait interface reporting we see in a detailed 10046 style Trace file.
SQLTXPLAIN give you an overview of how Oracle decided to execute the statement by providing execution and plan details from AWR or cursor cache, object statistics details, system statistics details, and optionally kicking off a SQL Tuning Analyzer run and providing the results in its final report. SQLTXPLAIN also has ability to compare two tuning reports and hopefully point you to a reason when you get one of those “runs fine in Test but not in Prod” tickets.
I have used SQLTXPLAIN about a dozen times and it does produce a nice report and helps document the environment surrounding the execution of the statement. I have tried compare a few times with varying results.